



How to Monitor Approach Temperature in Plate Heat Exchangers
- Blog
- How to Monitor Approach Temperature in Plate Heat Exchangers
How to Monitor Approach Temperature in Plate Heat Exchangers
Table of Contents
- What Is Approach Temperature?
- How Approach Temperature Relates to Efficiency
- Measurement Points and Sensor Placement
- Recording the Flow Conditions
- Trend Tracking Over Time
- The Link Between Fouling and Approach Temperature
- Comparison with the Design Value
- Using the Trend in Cleaning Decisions
- Data Quality and Calibration
- Conclusion
One of the most practical ways to monitor the performance of a plate heat exchanger is to track its approach temperature. This value shows the temperature difference between the outlets of the hot and cold fluids. Monitored regularly, it allows a drop in efficiency to be noticed early.
What Is Approach Temperature?
The approach temperature is the difference between the outlet temperature of the heated fluid and the inlet temperature of the heating fluid. As the value gets smaller, heat transfer is considered more effective. As it grows, the efficiency of the exchanger may be falling.
This definition can be applied in different ways depending on the flow arrangement of the plant. The definition in use should be stated in the record.
How Approach Temperature Relates to Efficiency
Approach temperature is an indirect indicator of how much of the heat transfer area the exchanger is actually using. When the surface fouls or the flow distribution is disturbed, the approach temperature rises for the same heat load. This increase may be one of the first signs of falling performance.
However, reading the value alone can be misleading. The approach temperature also changes when the process load, flow rate or inlet temperatures change.
Measurement Points and Sensor Placement
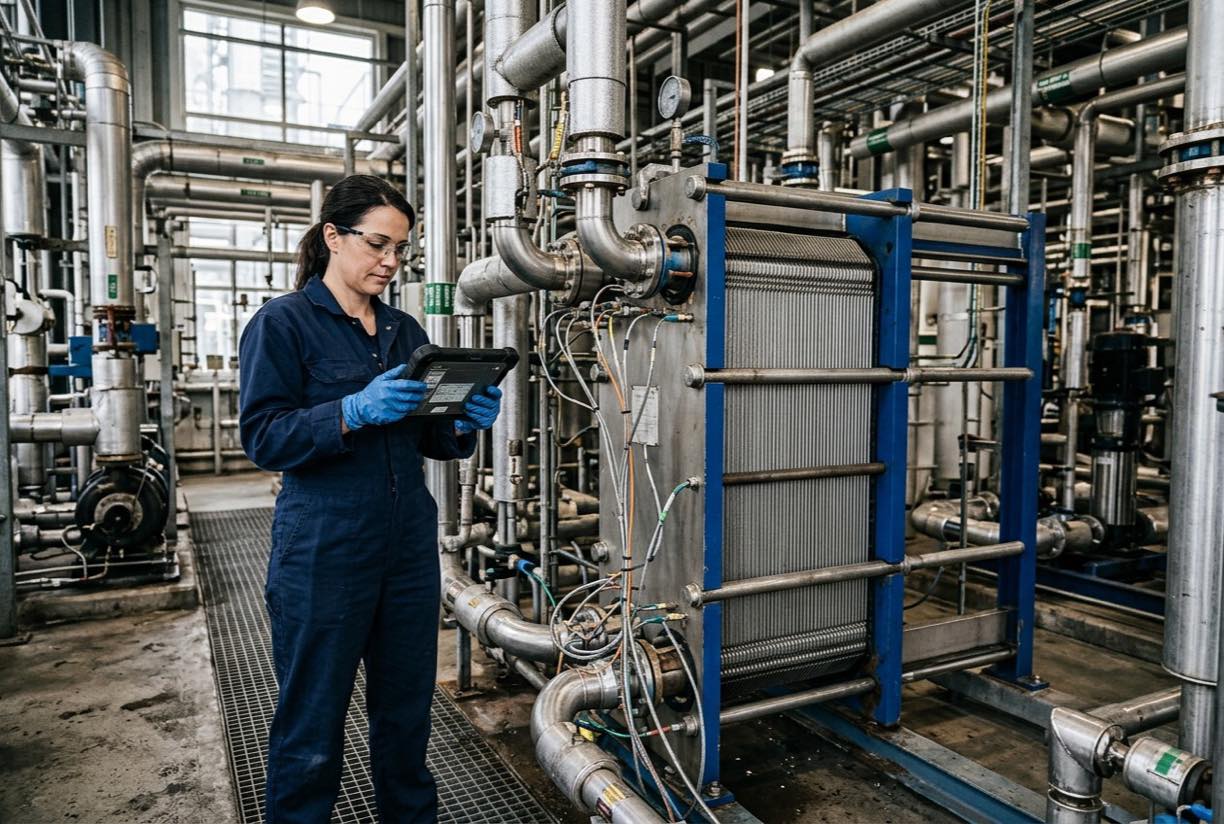
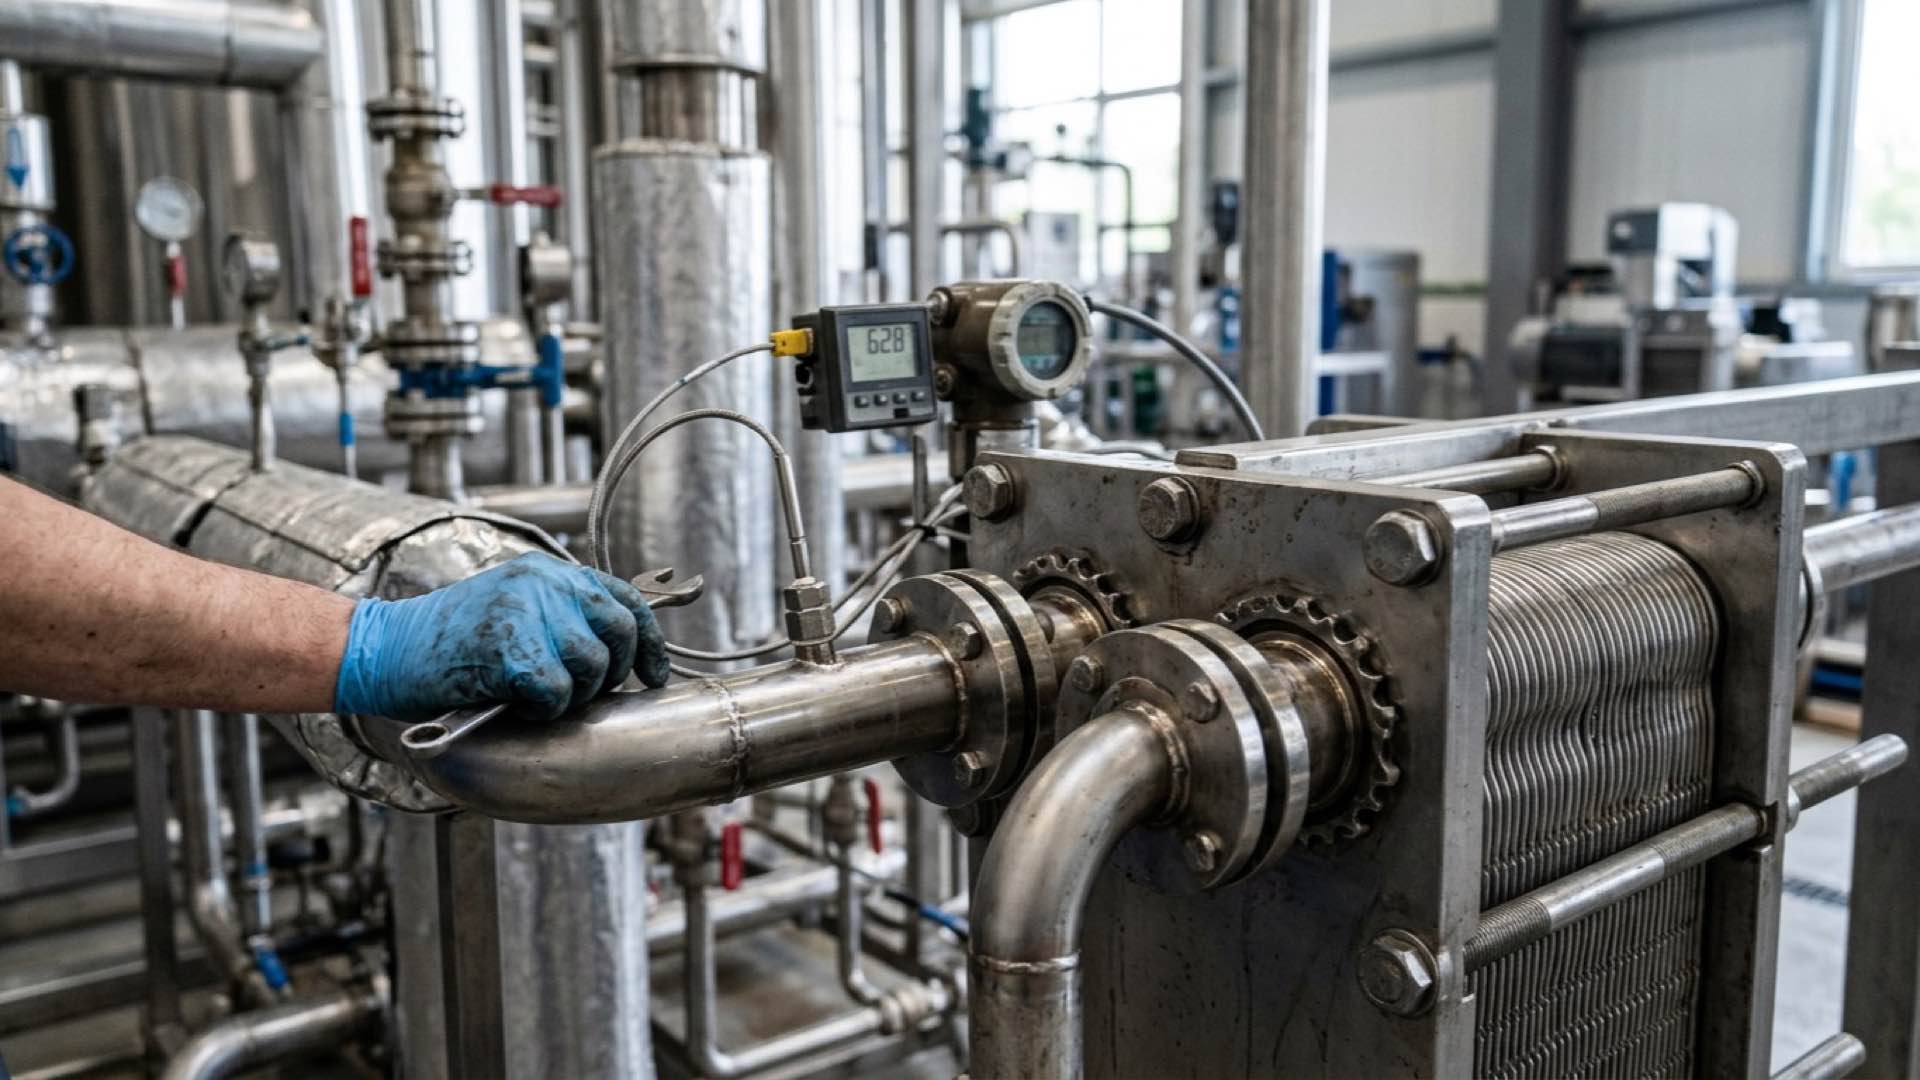
Four basic points are needed for the approach temperature: the inlet and outlet temperatures of both fluids. Sensors should be placed to represent the flow, on straight pipe sections and at points where the mixing is complete.
A sensor placed next to an elbow or a valve can affect the reading. The location should be defined with a documented reference for the measurement point.
Recording the Flow Conditions
Flow rate, pressure and process load should be recorded together with every temperature reading. Without this information, the reason for a change in approach temperature cannot be told apart. The same value taken at a different flow can carry a different meaning.
The record should be kept with a timestamp, so that the relationship between a change and an event can be seen later.
Trend Tracking Over Time
When the approach temperature is recorded at regular intervals, a trend forms. The trend shows whether performance is falling slowly or dropping suddenly. A trend chart is a strong tool for maintenance decisions.
If the trend shows a steady rise, the possibility of fouling or a flow distribution problem should be considered. A sudden jump may be a change in operating condition or a measurement error.
The Link Between Fouling and Approach Temperature
In a plate exchanger, deposits of scale, biofilm or product residue reduce heat transfer between the plates. This raises the approach temperature. Establishing a relationship between the degree of fouling and the change in approach temperature helps the cleaning plan.
This relationship is not the same in every plant, however. Each exchanger should be assessed against its own record history.
Comparison with the Design Value
The measured approach temperature should be compared with the design value. The design value should be taken from the exchanger manufacturer's calculation or from the project documents. The difference should be assessed with a note on the operating condition in which it occurred.
When the difference from the design value grows, an investigation should be started to find the cause. The investigation should include data analysis and, where needed, a check on site.
Using the Trend in Cleaning Decisions
The approach temperature trend is an important input for timing cleaning. A decision based on performance data instead of a fixed cleaning calendar can reduce both unnecessary cleaning and insufficient cleaning.
After cleaning, the same measurement should be repeated and the amount the approach temperature has fallen should be recorded. This is the most concrete way of confirming the effect of the cleaning.
Data Quality and Calibration
Because approach temperature is calculated from small temperature differences, it is sensitive to sensor errors. Temperature sensors should be calibrated regularly and their deviations recorded.
A sensor error can hide a real loss of performance or the opposite. For this reason the reliability of the measurement chain should be the first step of any assessment.
Conclusion
Monitoring approach temperature in plate heat exchangers gives an early and numerical view of performance. When correct sensor placement, recording of flow conditions, trend analysis and comparison with the design value are applied together, cleaning and maintenance decisions are made more accurately.
SS Proje provides technical support for the design, manufacture and monitoring of thermal systems. Performance acceptance values and monitoring frequency should be set for each exchanger using manufacturer data and the judgement of a qualified engineer.